
Problem:
For value added products like artisan goat cheese, the market demand is increasing. However, there is a mismatch between where people buy cheese, and where most traditional marketing is done. Most marketing is done at Farmers Markets and on farm site; however, most cheese consumers (76%) never buy cheese from these outlets, preferring to shop at grocery stores, especially chains. This means that success is based on getting into gourmet and chain grocery stores. Since artisan goat cheese also has a price increase (20% above most other cheese), it is important to target potential marketing expansion to places that have extra disposable income. This can be done using the US Census data for Median household income in the past 12 months (in 2010 inflation-adjusted dollars) (using 11 field GEOid2), so farmers can spend their time an effort targeting grocery stores and retail establishments in census block areas that have more wealth.
Analysis Procedures:
The US Census Bureau complies demographics every ten years, with community survey estimates done every year. This data is consolidated is available on the American Factfinder website. From this website, tabular data representing a given area (be it Census tracts or blocks, countys, up to national data) is available for several different subjects. The American Factfinder can be used to locate the US Census data for Median household income in the past 12 months (in 2010 inflation-adjusted dollars) (Table B19013). Geographically, the census tract data (-140) for median household income was obtained from nine different counties making up the Charlotte, North Carolina metropolitan area: Cabarras, Catawba, Cleveland, Davie, Gaston, Iredell, Lincoln, Mecklenburg, and Rowan. The shapefiles of the census tracts for all nine counties were downloaded from the US Census/TIGER website. All nine files were combined into a single shapefile using merge. Once the spatial and tabular data is downloaded, the column the join takes place using the 11 digit census tract code string (GEOID10 in the spatial data, and the Geotext for the tabular data). The data was then formatted into a professional quality map. The entire process is diagrammed in Figure 1.
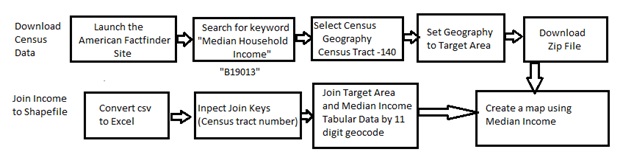
Figure 1: Flow diagram of analyzing US Census Data
Results:
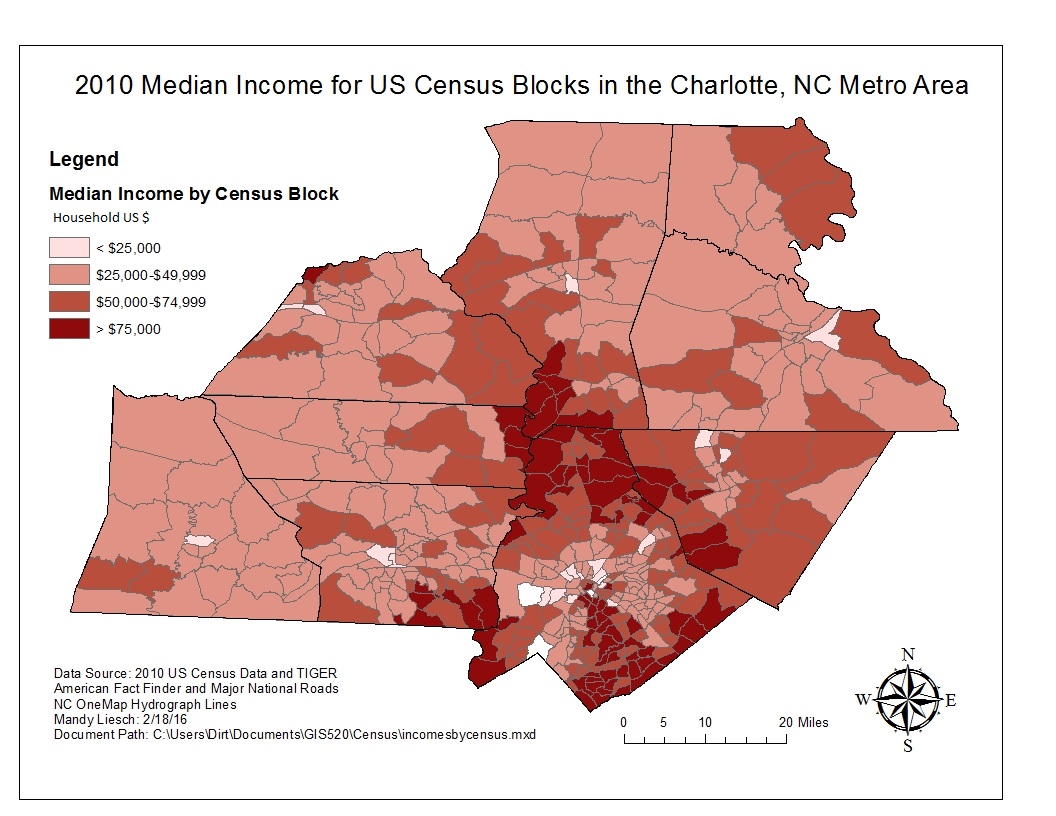
Figure 2: Median Income in a nine county area around the Charlotte metro area. Marketing will be targeted in the darker, wealthier areas.
The area that is around Lake Norman in Northern Mecklenburg/Southern Iredell/East Lincoln is an area that has the highest median income in the Charlotte metro area. This is the area that we can target our new marketing into gourmet grocery stores, and regular grocery chains. (We will most likely target brewpubs and high end restaurants dealing in local food as well). To verify this data I manually looked up some of the incomes by zipcode in the American Fact Finder to verify the census tract data. Wealthy areas matched up with the areas that showed as wealthy in the census tracts. This area is less than an hour from the farm, and we can use this area to secure some more customer orders. The joining of spatial and tabular data is pretty straightforward, but very powerful tool to use in marketing.
Application & Reflection:
Problem description: Now that this initial analysis on the median income is completed, we can continue to use census data available to choose our marketing strategy.
Data needed: Historic population, ethnicity of the target area, and age in the census block.
Analysis procedures: The next step is to study historic population growth in each of these census blocks. This can tell us which of these census tracts are increasing in population the fastest. Targeting fast growing, affluent areas, has the potential to increase cheese sales. Another byproduct of the goat cheese dairy is the practice of selling off the boy bucks (as well as “cull” does) for meat. During different times of the year, different ethnic and religious groups want quality goat meat. We can use the US census ethnic and origin data to determine where these religious or ethnic populations are located, making sure we have data. The market can also be split by age (young people with more disposable income tend to buy more “locally” based products), ethnic group (white people are more likely to buy cheese, other races and ethnicities tend to buy more meat).I also plan on exploring the details of the economic census (2012) for the region to assess the overall money spent in the region. All of these maps can be combined together into a matrix, so we can determine which census blocks/zip codes that we can start with.
