
Problem:
In order to understand several critical environmental dynamics that impact wildlife refuges, it is important to know that land use. In order to best manage the refuge, it is important to classify the land cover data from aerial photographs.
Analysis Procedures:
Image classification is used to simplify complex imagery (e.g. aerial orthophotos, satellite images, etc.) into discrete categories. The user identifies areas as a polygon for each category, and the software compares the pixel values of the identified areas to the rest of the image. The software then puts out a final categorized raster. Raster images of the area of interest should be obtained in a fine enough resolution that land cover types can be visually identified. If the classification will include vegetation, raster data should use the near-infrared band, as this will increase the contrast between vegetation and other land cover categories. The orthophoto of the Blackwater Wildlife Refuge in 2010 has multiple bands, which we can transfer into infared bands to classify vegetation. Several small polygons are selected from homogeneous areas of a land cover class (i.e., several polygons in the water, several polygons of the forest, etc.). These polygons are put into a training dataset. Then all training polygons with the same land use were merged together, and an interactive supervised classification was run. The output raster was exported to a GRID file, and the area of each land use type was calculated. To obtain a potentially better classification, the process was repeated using additional polygons. Figure 1 is the flow diagram of this process. The Procedure-Log can be found here.
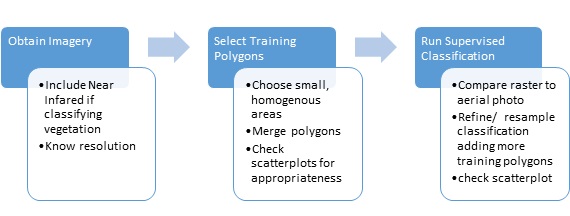
Figure 1: Flow diagram for image reclassification.
Results:
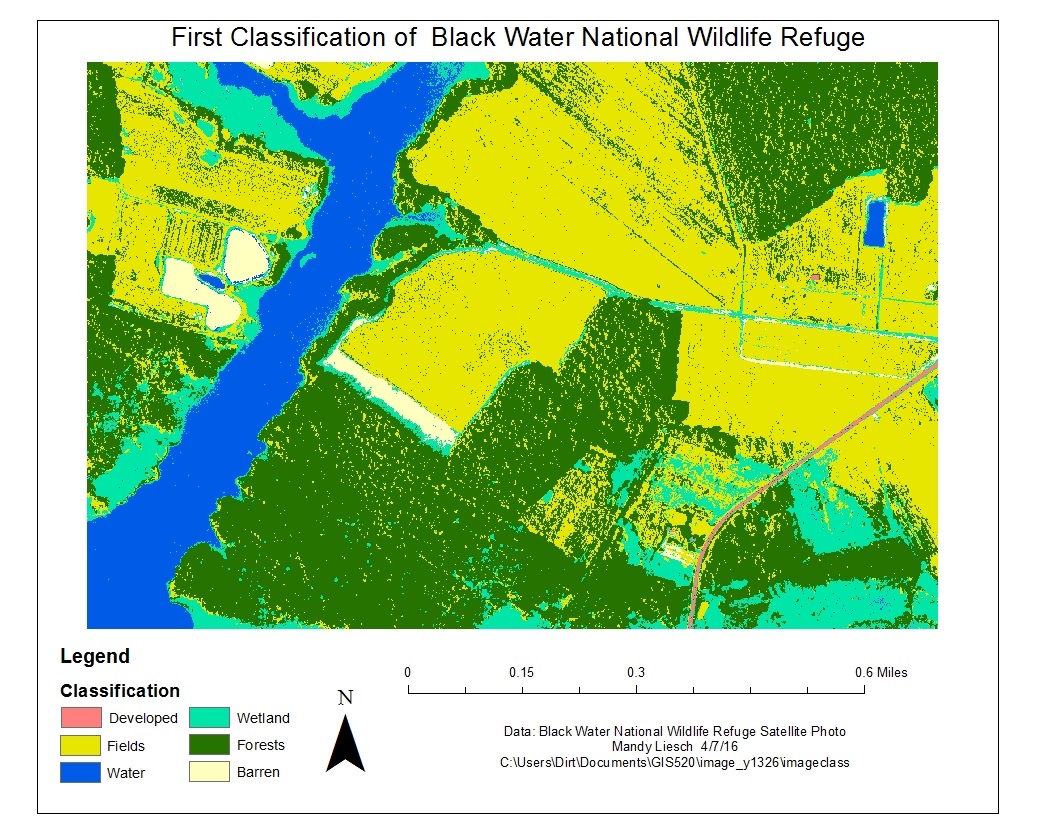
Figure 2: The initial image classification raster file. Notice that water is often misclassified as swampland, as are the shadows on the orthophoto. However, it is a fairly good representation of the area.

Figure 3: Reclassification attempt number two. In this case, the water is better represented, however, the shadows cast by the forest are now classified as water. Attempts to correctly classify the shadowed regions resulted in severe errors in classification across the rest of the map. Click on map for enlarged image.
Application & Reflection:
Problem description: I live in the City of Creedmoor, up in Granville County. It I a poor, rural town that recently had an uptick of stormwater infiltration issues in the main street periphery. The Baptist church recently paved their parking lot, and it is causing an increase in flow and intensity on the creek.
Data needed: In order to calculate stormwater runoff and run the overland flow simulations, we need soil information, topography, and land use. We can use the historic and current satellite imagery (with infrared colored bands) to monitor changes to land use, and identify potential locations for stormwater best management practices.
Analysis procedures: We will use the interactive supervised classification tool to analyse the different land use plans in the city, and can “ground truth” the data using field analysis, and select more training polygons to get the best classification possible.
