
This is another one of the ESRI Web Courses
Problem:
There are two major types of GIS Data, vector and raster data. Vector data models represent geography as discrete spatial features. Raster data models represent geography as a continuum, like temperature, land use, and elevation. These data can be combined together into a suitabiity analysis. This is called site selection, and can be used to find the best place to build something. The objective of this tutorial is to determine the best location to build a vineyard, and the best location for Bald Eagle habitats.
Analysis Procedures:
There are three different methods that can be used to perform site selection: binary, weighted, and fuzzy logic. This tutorial focuses on all three methods of site selection. Binary Selection means that a site is either suitable (1) or unsuitable (0). If multiple rasters are analyzed, ALL rasters must be considered suitable to be an acceptable site. Weighted site allow the ranking of raster cells to a relative importance. This results in next-best site options. Fuzzy logic assigns membership values to locations ranging from 0 to 1: 0 indicates non-membership (or unsuitable), and 1 indicates full membership (or suitable). The value of the raster cell is calculated from all of the input raster. This is not the same as a probability.
Prior to performing weighted site selection, all of the raster data must be reclassified in order for suitability to be measured on the same scale (e.g. 1-5, 1-9, etc.). After each layer has been reclassified, a weight (i.e. percentage) must is calculated for each layer to reflect each layer’s significance to the model. The vineyard should be approximately 200 to 800 feet in elevation. We also have a solar radiation raster that accounts for aspect in it. Next, we reclassified the surfaces, you will weight the layers and overlay them using the weighted overlay tool (Figure 3). Use of this tool requires that you assign a percent of influence, or relative importance, to each layer being overlaid. If you want to do a binary analysis of sites that are suitable, or not, you can use the raster calculator.
Fuzzy logic is ideal for conditions like geologic mineral deposits and animal habitats, as the data does not have discrete boundaries. Fuzzy logic is good for when prediction is imprecise because it allows the model to include inaccuracy in the data.Prior to using fuzzy logic for site selection, the raster data must be reclassified based on a selected fuzzy membership type/class that best fits the data. The surfaces can then be overlaid by selecting an appropriate overlay type that combines two or more of the membership data.
- Far from human disturbances, such as roads, power lines, cities
- Close to water
- Not too densely or sparsely covered by forest—usually between 40% and 70% tree cover
All the fuzzy membership layers can be overlaid together to get a single fuzzy surface that takes all three input layers into consideration (Figure 4). Three membership layers were overlaid to achieve this result: distance to water, distance to human disturbances, and percent tree cover. The distance to water layer was created using a “small” type fuzzy membership. This type is used when small values have high membership, i.e. eagles are more likely near water. The human disturbance layer was created using a “linear” type fuzzy membership. This makes membership increase as the distance from human disturbance increases. Lastly, the tree cover layer was created using a “near” type fuzzy membership. This type is used when memberships valued at 1 occur at the midpoint of the data, i.e. eagles do not prefer extremely dense or extremely sparse tree cover. Click map to view larger image.
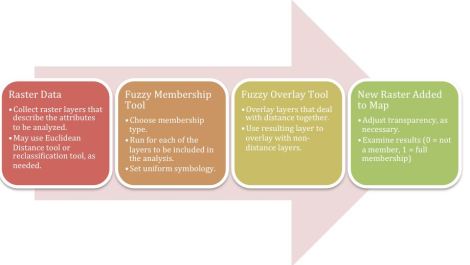
Figure 1: Flow Diagram for Site Selection Analysis
Results:

Figure 2: A representation of the vineyard suitability (5 is best) taking into account solar radiation, elevation, distance from highways, and slope.

Figure 3: This is the same vineyard using a binary classification. In order to be acceptable (1), ALL the traits from the previous map (Fig 2). This results in a lower proportion of suitable areas.
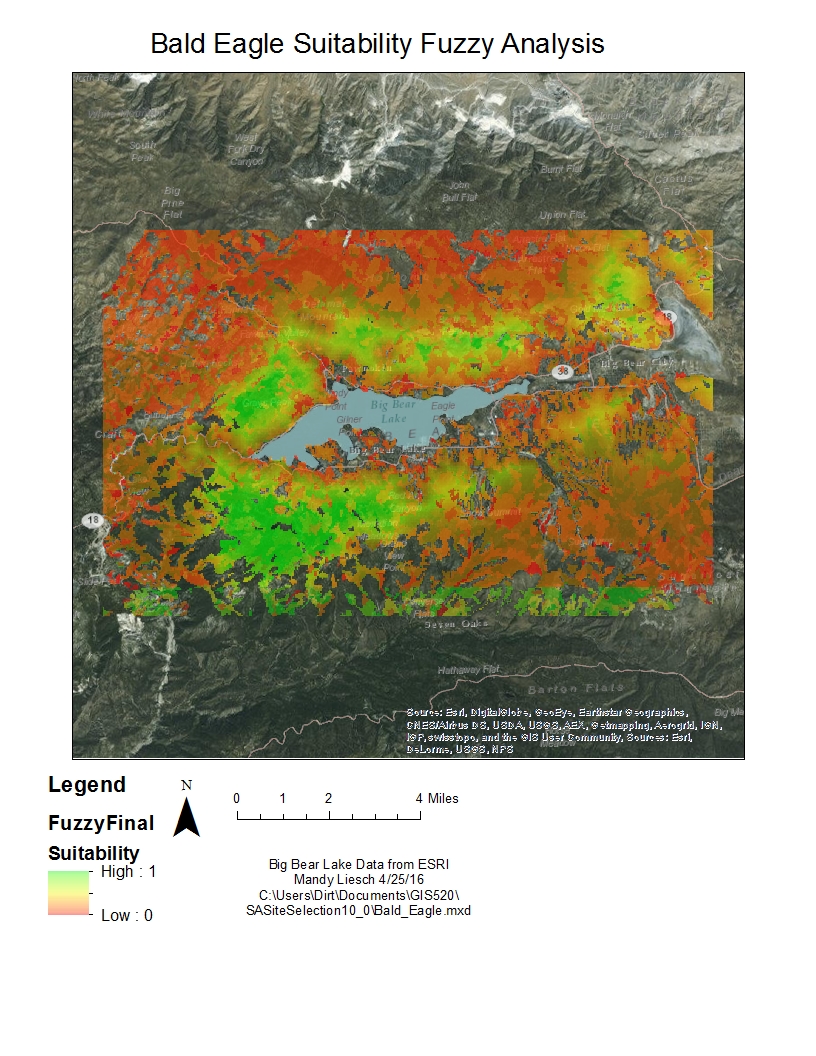
Figure 4: This image depicts the results of using fuzzy logic for site selection when determining possible bald eagle nesting habitat near Big Bear Lake, CA. Red indicates areas where bald eagle nesting is not likely, green indicates nesting is highly likely, and yellow indicates an intermediate possibility for nesting.
Application and Reflection:
Problem description: We are looking at places on our future 17 acre farm property to place our new rabbit barn. Rabbits need to have as much shade as possible, as they become sterile if their body temperature is above 85 degrees F, and we do not want to pay a lot to cool them artificially. We want the source to be on as flat of land as possible, so we do not have to pay a lot of grading. We also need good drainage. We also want a source that is near our well pump, the electric lines, and our house, so I can check on does three times a day giving birth.
Data needed: Sunshade and shadow casting (lidar derived dataset), land use, topography, soil type, proximity to electric and water.
Analysis procedures: Now that we have determined what we need, we can proceed to run an analysis, first binary, then fuzzy logic. We want our electric and septic to be no more than 15 m from the barn, have the barn have as much shade as possible (100% is ideal), we want the slope to be between 0-5% ideal, and 5-15% is middle of the road. We would like a soil that is well drained, and ideally, do not want to have to clear any land.
Certificate of Completion
