
Problem:
To be successful in a small business, it is critical to understand their customer base. If a business wants to expand their customer base, they need to understand where their current customers reside, so they can target new customers through a targeted advertising campaign in underrepresented areas of Wake County.
Analysis Procedures:
After initial review of attribute tables, the address locator function was set up in ArcMap. Initial data was geocoded using a five digit zip code through ArcCatalog, followed by a secondary analysis using a street address (US Streets with Zone). The correct address locator was then linked to the reference data. Once the appropriate address located was activated, the businesses’ data could be batch geocoded by using the appropriate address fields in the tabular data. For the matching to street addresses, a new field had to be created for the addresses that combined the street number, with the street name categories. Then the data (in three categories: matches, ties, and unmatched) can be reviewed and corrected. Some of the corrections were missing/incorrect zip codes, or inappropriate street abbreviations. Professional maps were created to visualize customers by zip code and by addresses. A flow diagram is shown below (Figure 1). A detailed procedure log is also available.

Figure 1: The detailed flow diagram of the geocoding procedure.
Results:

Figure 2. Customers geocoded by zip code. The main drawback of this method is that multiple attendees in the same zip code cannot be differentiated spatially. The showcase coordinators would not be able to visualize where attendees were coming from within the zip code areas.
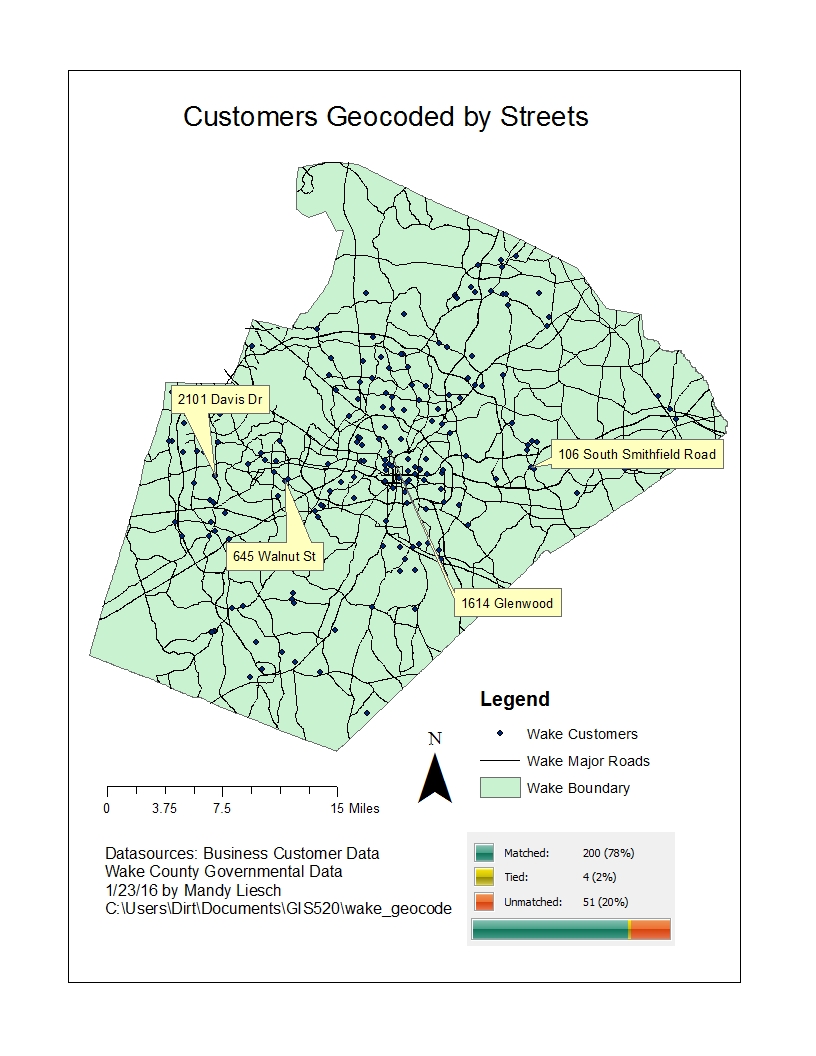
Figure 3: Customers geocoded by street. As this method allows attendees to be identified uniquely by house number, the showcase coordinators will be able to better visualize what areas of the county their attendees are coming from.
Application & Reflection:
Problem description: My dream of buying a goat dairy in Western North Carolina has experienced a major setback. So, we are buying a farm from scratch on a new business plan in Granville County. This farm will focus on sales of rabbit meat, furs, free range duck, and pheasant for the table (as opposed to sales for hunting dogs). Our primary market for that will be the State Farmers Market. However, we want the pheasant operation to be our biggest growth area.
Data needed: In order to make our first sales trip, we need to find restaurants that feature local food, as well as exotic, seasonal rotating menus in our target markets (Triangle). To do this, we can get the addresses of the gourmet (four and five star restaurants) in the triangle region.
Analysis procedures: From this list, we can target our sales efforts (and future delivery routes) in the area that has the highest amount of restaurants. We can geocode this both by zipcode, and street address. We can then target our sales efforts to areas that the data is clustered.
